Let’s talk about data. Not Big Data. Your performance data
Entrepreneurs hear a lot about vision and passion. About being lean and about pivoting. About customers and canvases. But we don’t talk a lot about measuring and monitoring the critical business factors that will determine your success or failure. Maybe because it’s hard, or maybe because it’s boring.
At the core of every real entrepreneur’s vision is a business, and at the core of every business are numbers — metrics that indicate what’s going on and whether the company is on track or off track. Not every co-founder has to be a numbers jockey, but every team needs someone who is passionate about performance metrics. The very best entrepreneurial teams hold themselves responsible for delivering the numbers.
So what numbers do you monitor? Not all business metrics are equal, and metrics that are critical for one company may not be critical, or even relevant, for another. How do you decide which metrics to focus on, and at what level of detail?
The Management Dashboard.
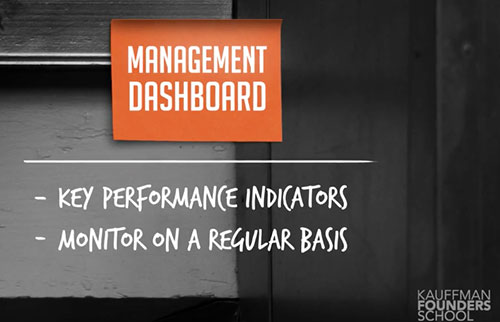
One of the most valuable tools for keeping track of your progress is the management dashboard. The point of a dashboard is to track a limited number of the most important metrics that are most indicative of your company’s performance and trajectory. In this era of big data and data analytics it might be tempting to measure and analyze hundreds of metrics, but the art of data science is figuring out what data is most critical. You should focus on the best indicators of the health and progress of your company, and figure out what analysis or representation of the data is most meaningful and actionable.
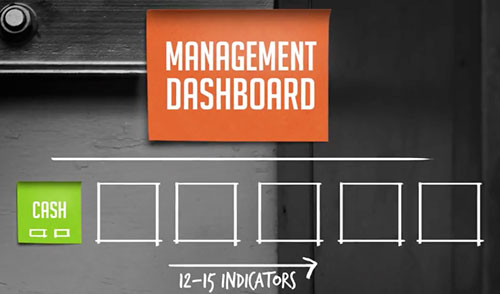
In the Kauffman Founders School video series, “The Art of Startup Finance,” I talk about creating a dashboard of 12 to 15 critical metrics. Exactly which metrics you should monitor will be unique to your company, but they will probably fall into the categories below. For each category, I offer some illustrations of possible metrics.
- Sales: Revenues vs. budget, new customers, renewal rate, upsold customers, sales force productivity, time to acquire, cost to acquire, market share, customer lifetime value, wins vs. losses.
- Marketing: Qualified prospects, qualified leads, click thru rates, conversion rates, cost per lead, marketing ROI, website traffic, customer satisfaction, competitive rank.
- Operations: Time to install, customer support tickets, time to resolve, employee retention, employee productivity, plant/equipment productivity.
- Development: Status against deadline, status against budget, bug resolution, team productivity, recruiting efficiency.
- Finance: Net cash vs. budget, burn rate, months of cash remaining, days receivables, days payables, bank covenant ratio.
This framework, which is organized around functional groups, may or may not be right for your company. Another way to organize your metrics is around core strategies or key milestones. Let’s say you have four to six core strategies in this year’s plan relating to products, customers and team development. Maybe that’s a better way to organize and manage your dashboard, rather than using a traditional functional framework.
You may have to experiment to figure out which categories and metrics are most useful for you and your team. You will quickly discover that some metrics are not very enlightening. For example, your renewal rate may be more meaningful and useful than your customer satisfaction scores. Some metrics may need tweaking – graphing your website traffic may not be as useful as indexing your website traffic against your key competitor’s.
You also need to consider how much effort to put into collecting this data and with what frequency. Some metrics you should monitor daily or weekly; others you may just monitor monthly or even quarterly.
Some of the examples above are probably too specific to include on your company-wide management dashboard, but they might be on the dashboard for a functional group or project team within your company. At each level of decision-making it makes sense to have a relevant dashboard that supports that process. So you might have several dashboards within the company, from which you draw a summary management dashboard.
To start, keep it simple. Don’t get carried away and try to monitor too many different, complex metrics. Your dashboard and your metrics will evolve over time as your business evolves and as you discover what is valuable and what is not.
If you put a simple, useful dashboard in place, you will be miles ahead of most entrepreneurs, and you will give yourself a substantial competitive advantage.
Please share your own experiences with monitoring key performance metrics in the comments below, including metrics you have found particularly useful or surprisingly useless. Thanks!